Liteset benchmark results
A side-by-side comparison of Liteset (Litestar + Uvicorn, async) against Apache Superset 6.0.0 (Flask + Gunicorn, sync) on identical hardware, dataset and load profile. The only variable between runs is the backend's concurrency model — both stacks run 4 workers against the same constrained PostgreSQL 16 instance and the same SSB Scale Factor 10 dataset (~60 M rows). See the methodology for the full test-bench description.
Headline metrics
Throughput (RPS)
↑ betterDashboard Fan-Out, 200 concurrent users
Median response time
↓ betterDashboard Fan-Out, 200 concurrent users
Error rate
↓ betterDashboard Fan-Out, 200 concurrent users
Throughput at 1 s I/O latency
↑ betterControlled IO Latency Sweep, 50 users
These four metrics tell a single story: moving the web layer from blocking Gunicorn workers to a single ASGI event loop changes the cost model of an IO-bound Superset deployment. While one request waits on a 10–50 s analytical query, the async worker keeps serving others; a sync worker is simply blocked on socket.recv() and cannot accept new work.
Scenario 1 — Dashboard Fan-Out
Models a typical analyst: loading a dashboard with 3–13 charts, each firing its own SQL query to the analytical DB. Run at 200 concurrent users for 15 minutes.
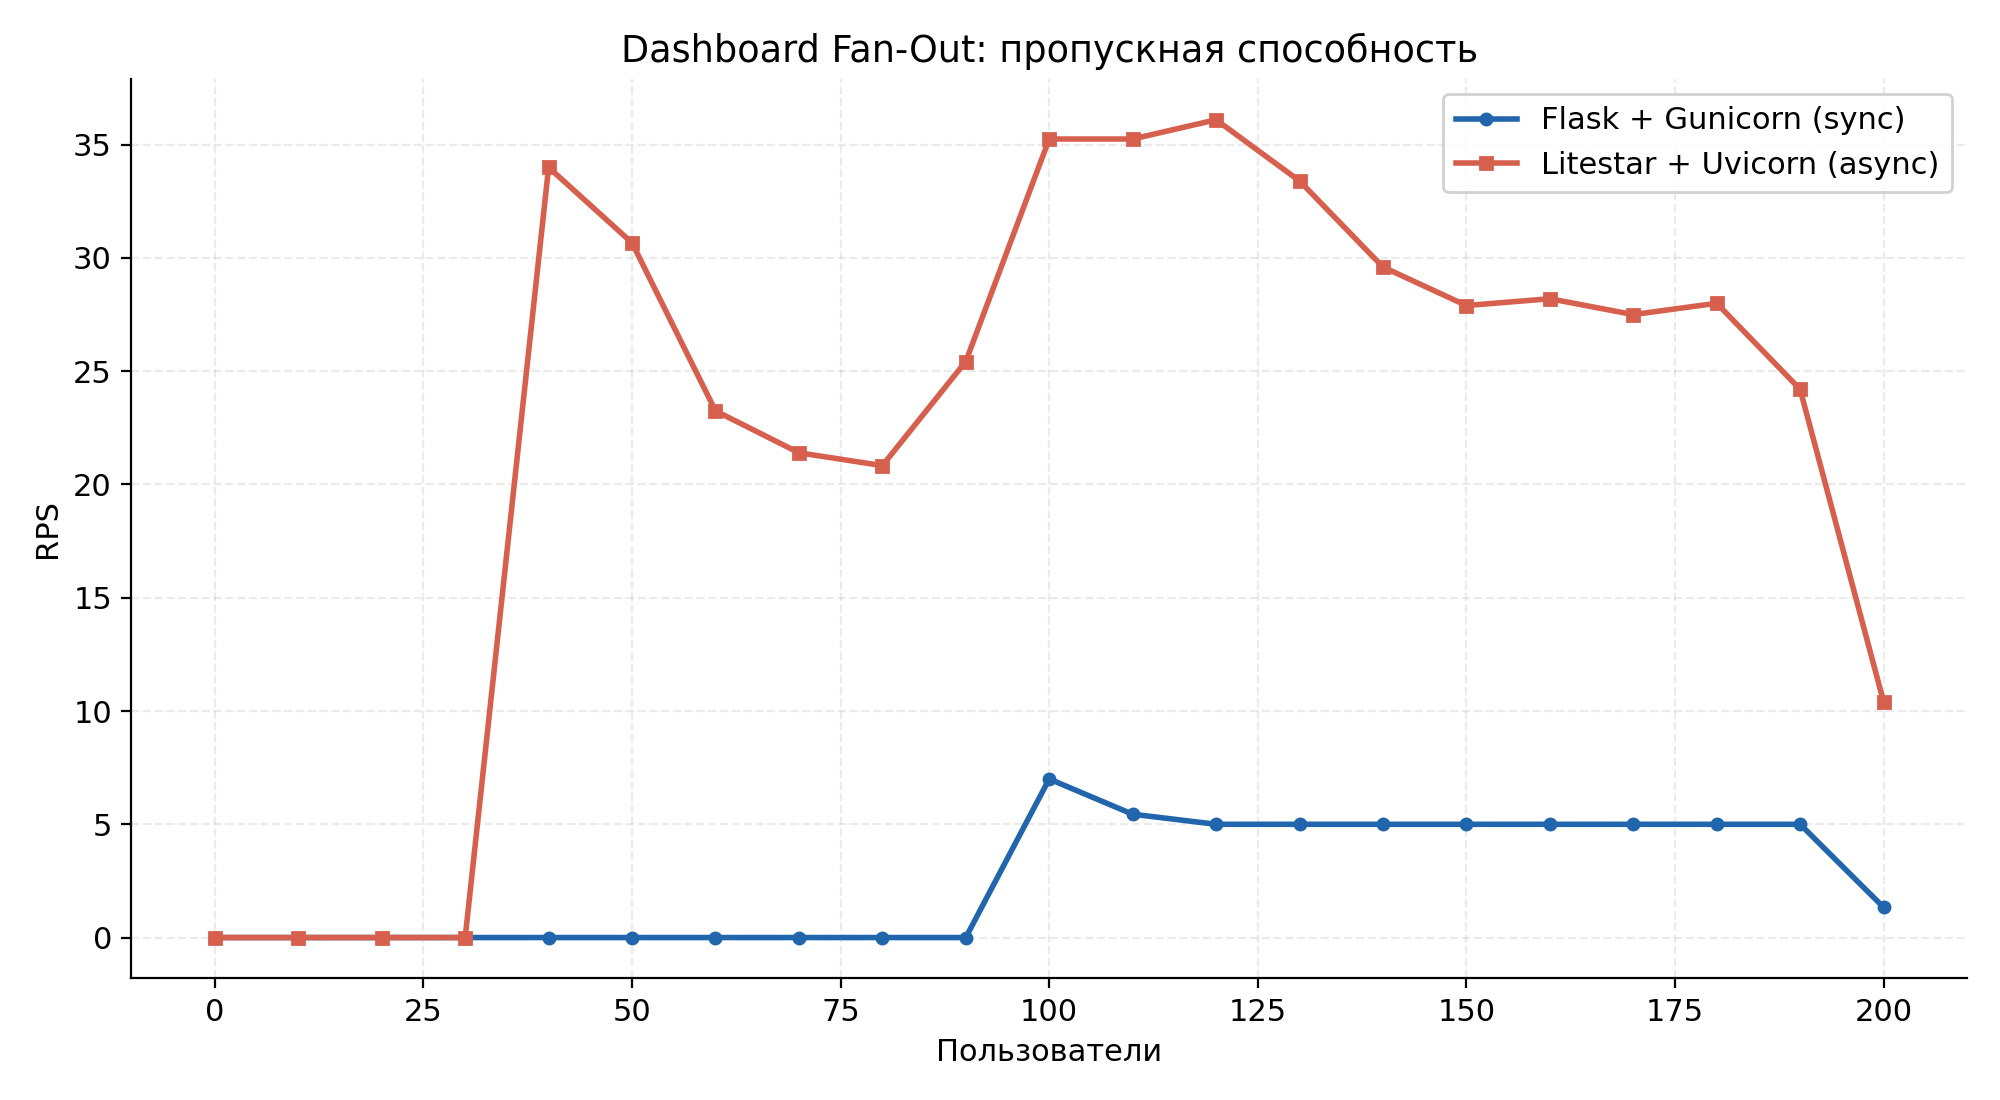
Throughput (RPS) over the run. Chart titles are in Russian — figures are reproduced from the diploma testing report.
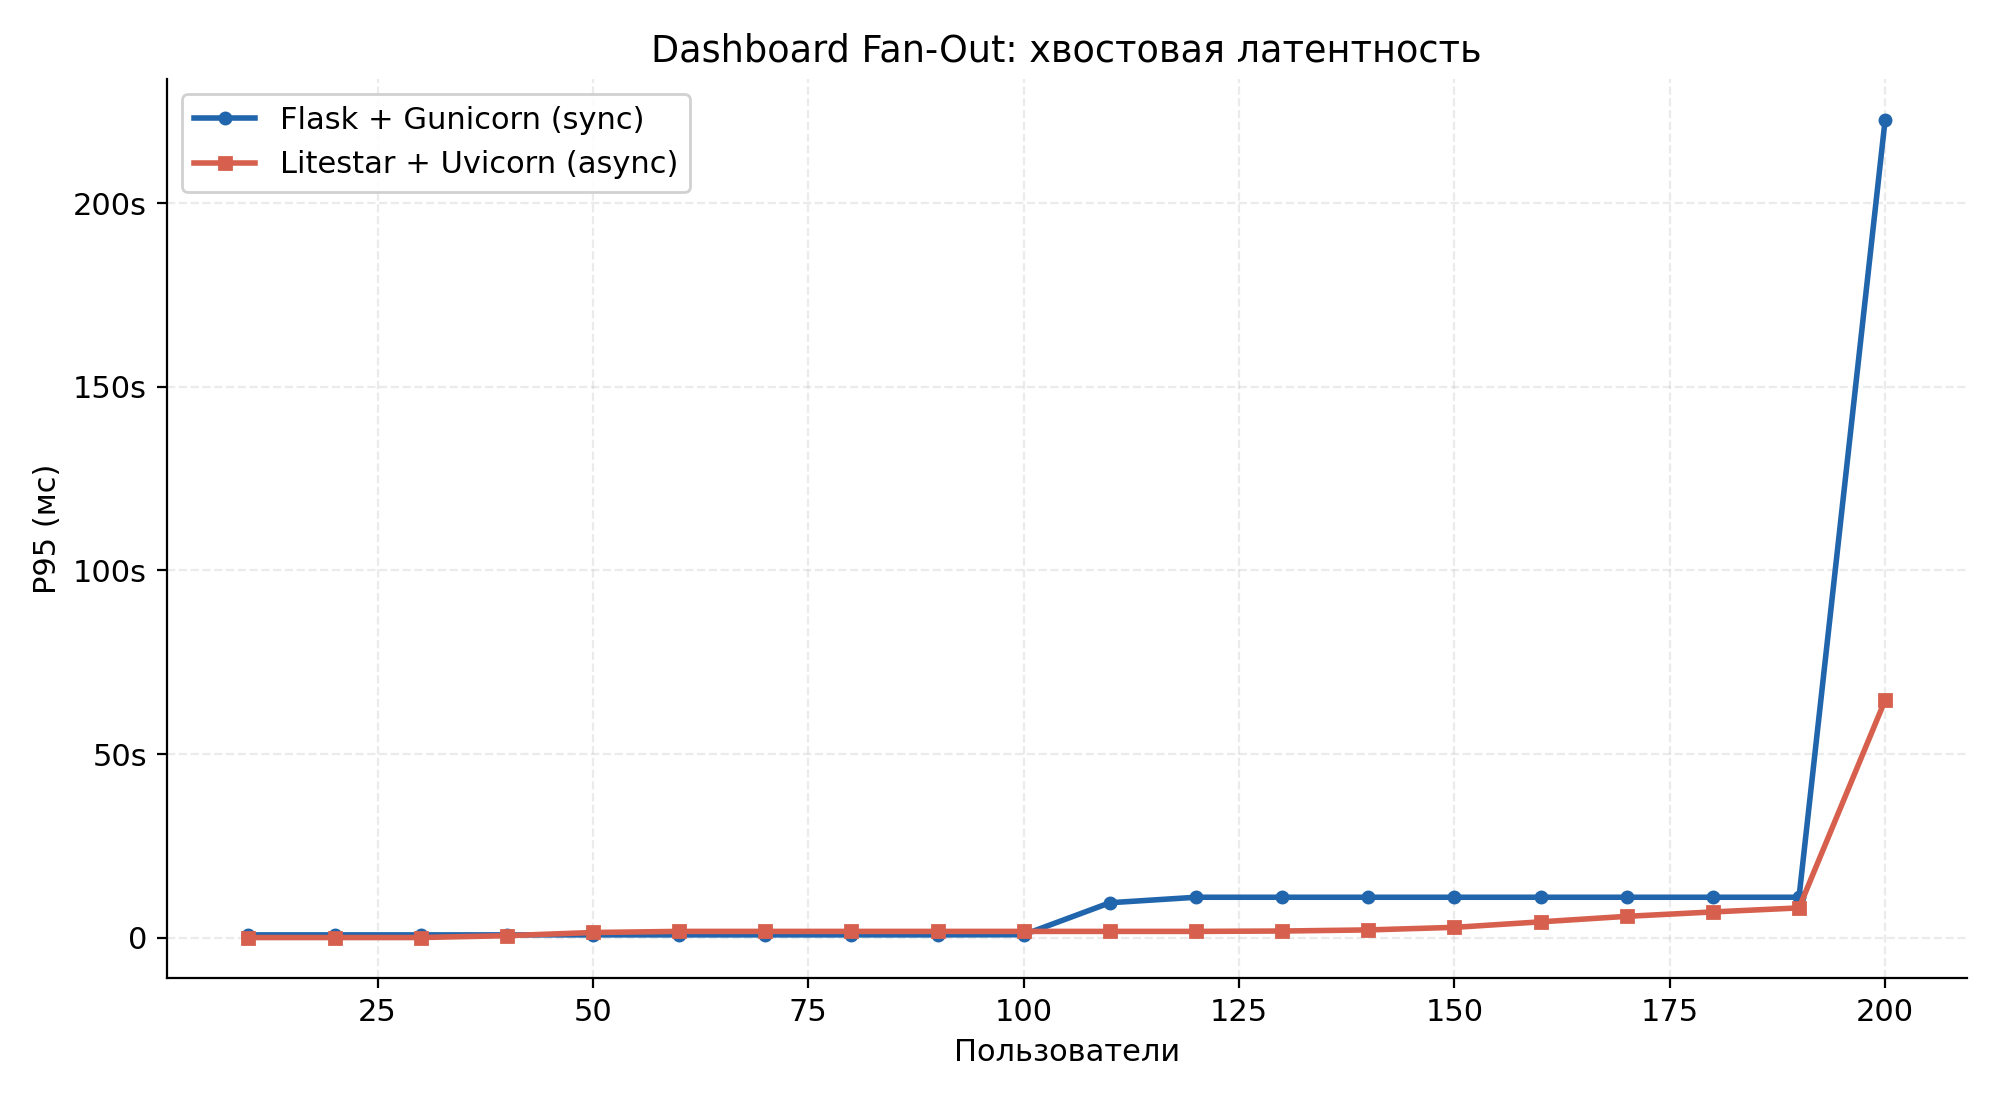
p95 tail latency over the run.
| Metric | Apache Superset (sync) | Liteset (async) | Δ |
|---|---|---|---|
| Requests served | 1 129 | 9 510 | 8.4× |
| RPS (aggregate) | 1.27 | 10.57 | 8.3× |
| Median response (ms) | 134 000 | 4 500 | 29.8× |
| p95 (ms) | 300 000 (timeout) | 133 000 | 2.3× |
| Error rate | 32.8 % | 7.4 % | −25.4 pp |
| CPU avg / max (%) | 12 / 169 | 121 / 386 | — |
| RAM max (MB) | 856 | 900 | +5 % |
Throughput rose 8.3× and median latency dropped from 134 s to 4.5 s (29.8×). In the sync system, 132 of 200 csrf_token requests — a trivial call that never touches the analytical DB — timed out, because every worker was blocked on a heavy query. The async backend's higher CPU usage (121 % avg vs 12 %) reflects that Uvicorn is actively working in the event loop, while Gunicorn spends most of its time blocked on system calls.
Scenario 2 — SQL Lab Interactive Session
Models a data engineer running SSB queries sequentially via the SQL Lab API. Run at 50 concurrent users for 10 minutes.
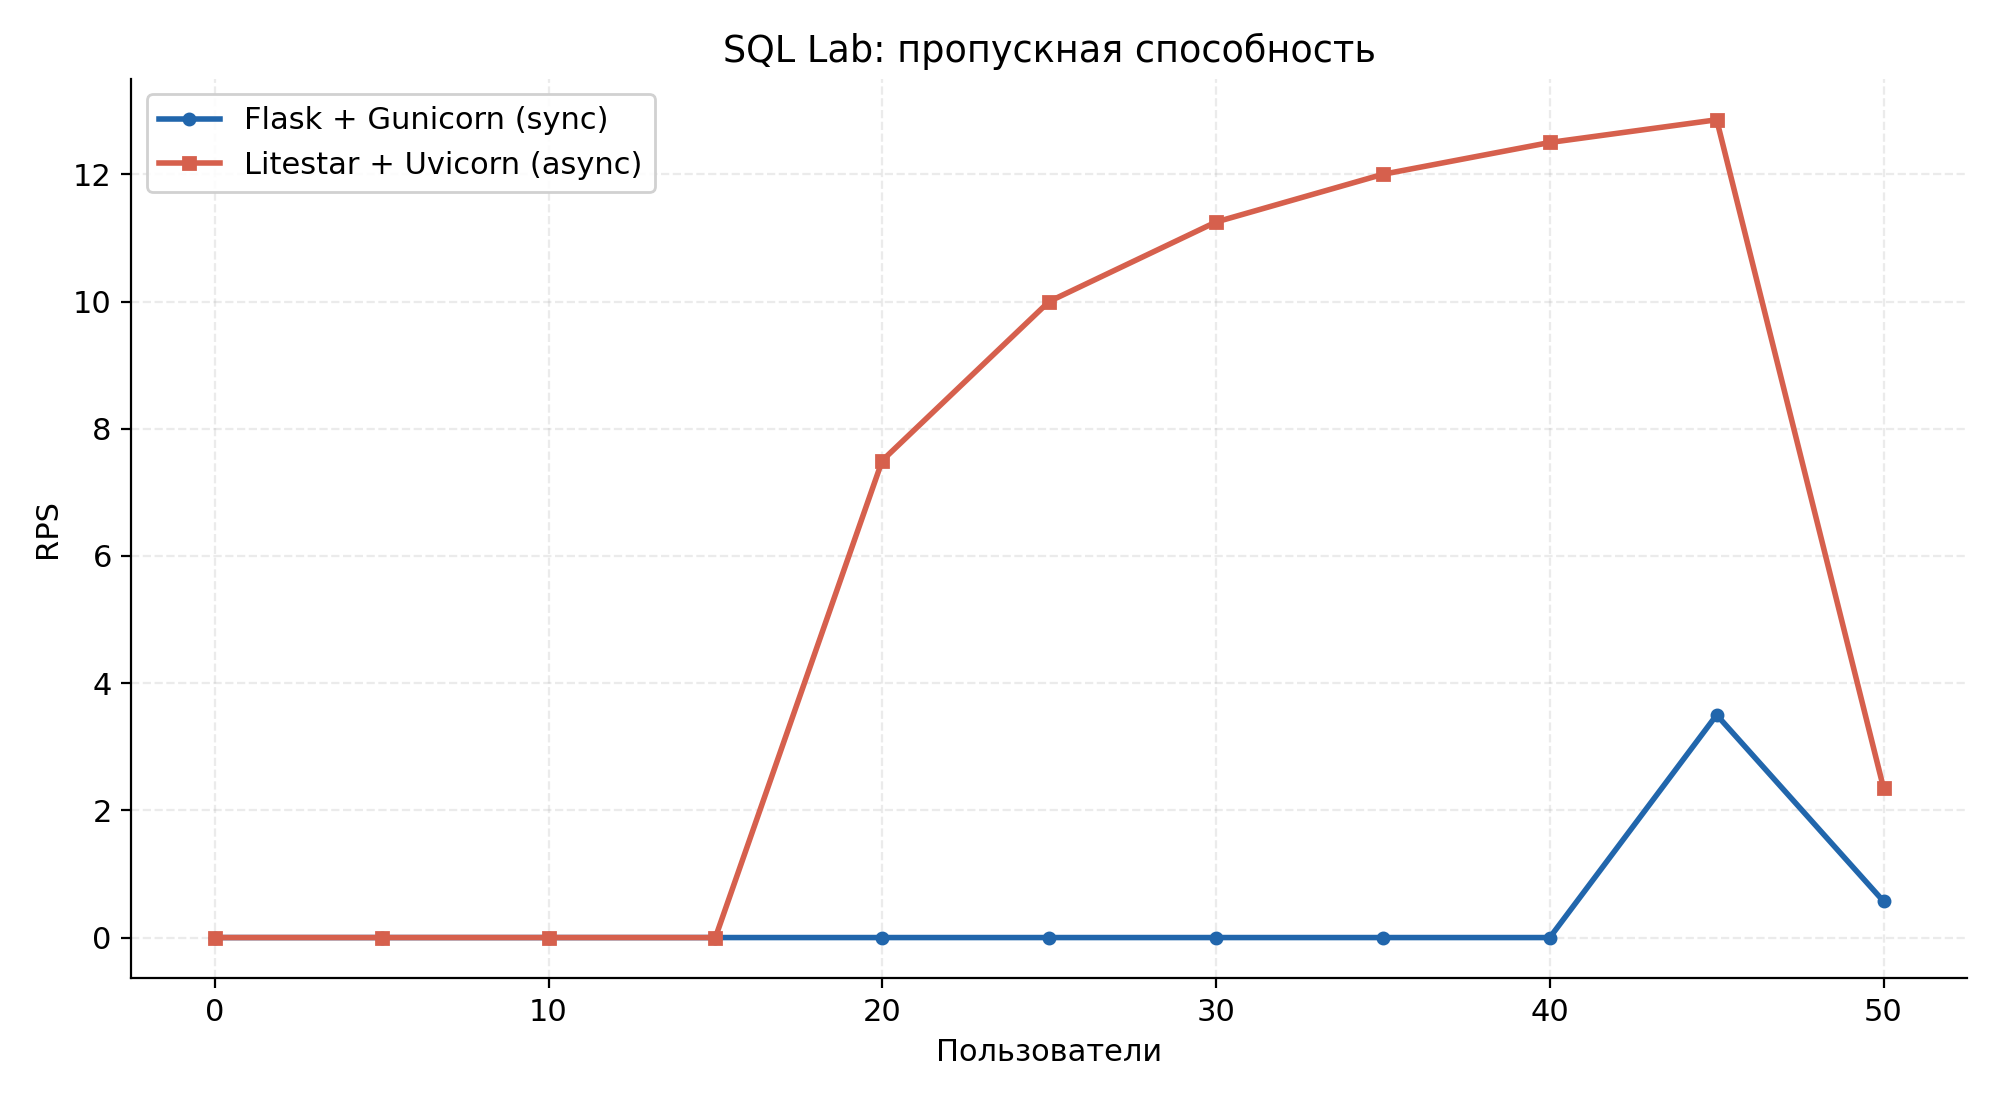
Throughput (RPS) over the run.
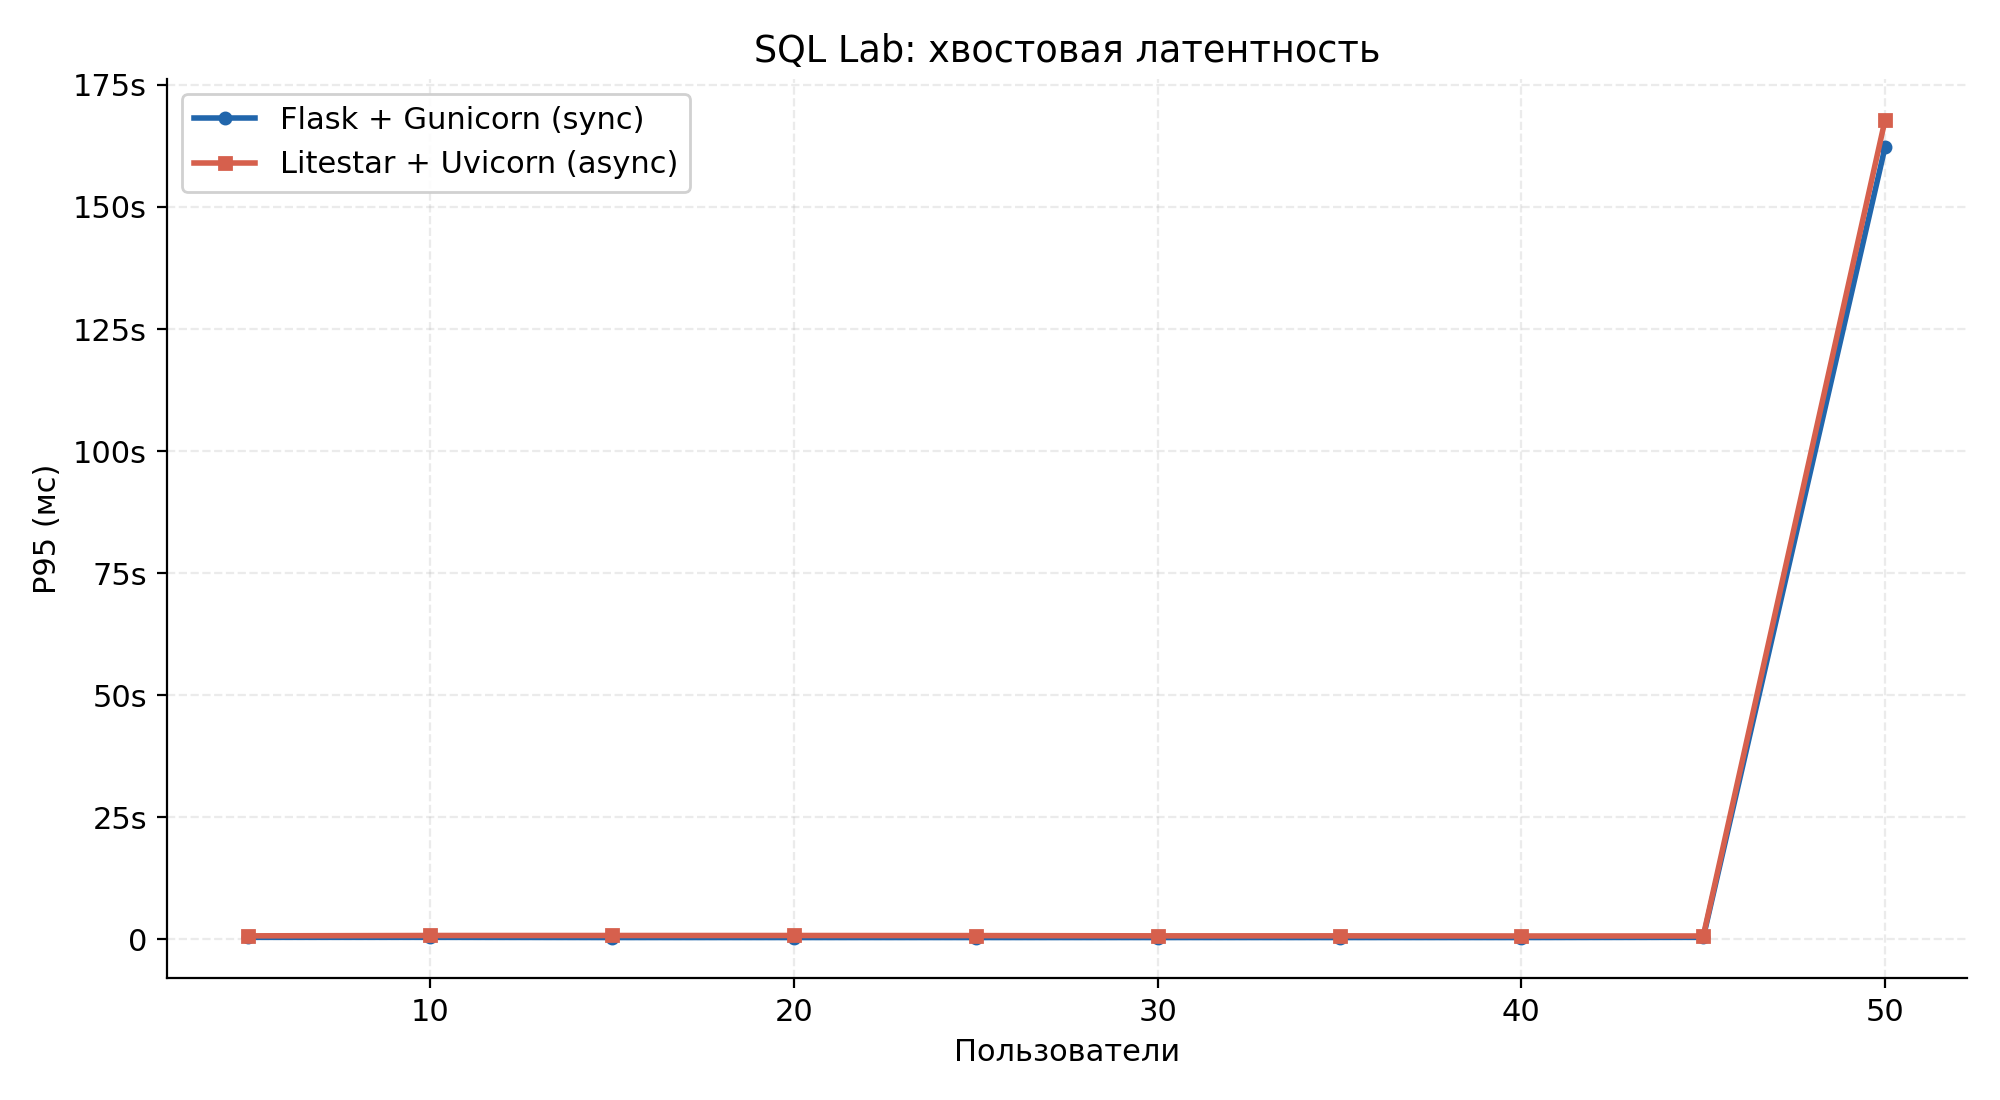
p95 tail latency over the run.
Because each user runs queries sequentially and the bottleneck is the 4-vCPU PostgreSQL instance, heavy-query throughput is at parity — that is the expected result. The difference shows up in the responsiveness of infrastructure endpoints that don't touch the analytical DB:
Infrastructure endpoint response time (median, ms):
| Endpoint | Apache Superset (sync) | Liteset (async) | Δ |
|---|---|---|---|
/security/csrf_token | 810 | 13 | 62× |
/security/login | 26 000 | 380 | 68× |
/database/ | 1 800 | 190 | 9.5× |
Aggregate results:
| Metric | Apache Superset (sync) | Liteset (async) | Δ |
|---|---|---|---|
| Requests served | 262 | 262 | — |
| Errors | 10 (3.8 %) | 9 (3.4 %) | −0.4 pp |
| p95 aggregate (ms) | 291 000 | 278 000 | −4.5 % |
| Median SSB queries (ms) | 135 000–184 000 | 101 000–233 000 | ≈ parity |
| CPU avg / max (%) | 3.8 / 97 | 5.5 / 223 | — |
| RAM max (MB) | 822 | 975 | +19 % |
In the sync stack, light endpoints degrade by two orders of magnitude under load — csrf_token median climbed to 810 ms and reached 103 s at p90, while login took 26 s. For the user this is the difference between a UI that hangs on sign-in and one that stays responsive while analytical queries run in the background.
Scenario 3 — Controlled IO Latency Sweep
Isolates the effect of IO latency on throughput by replacing real SQL with pg_sleep at fixed delays (10 ms – 5 s). Run at 50 concurrent users, 2 minutes per delay. This is the cleanest comparison of the two architectures because DB variability is removed entirely.
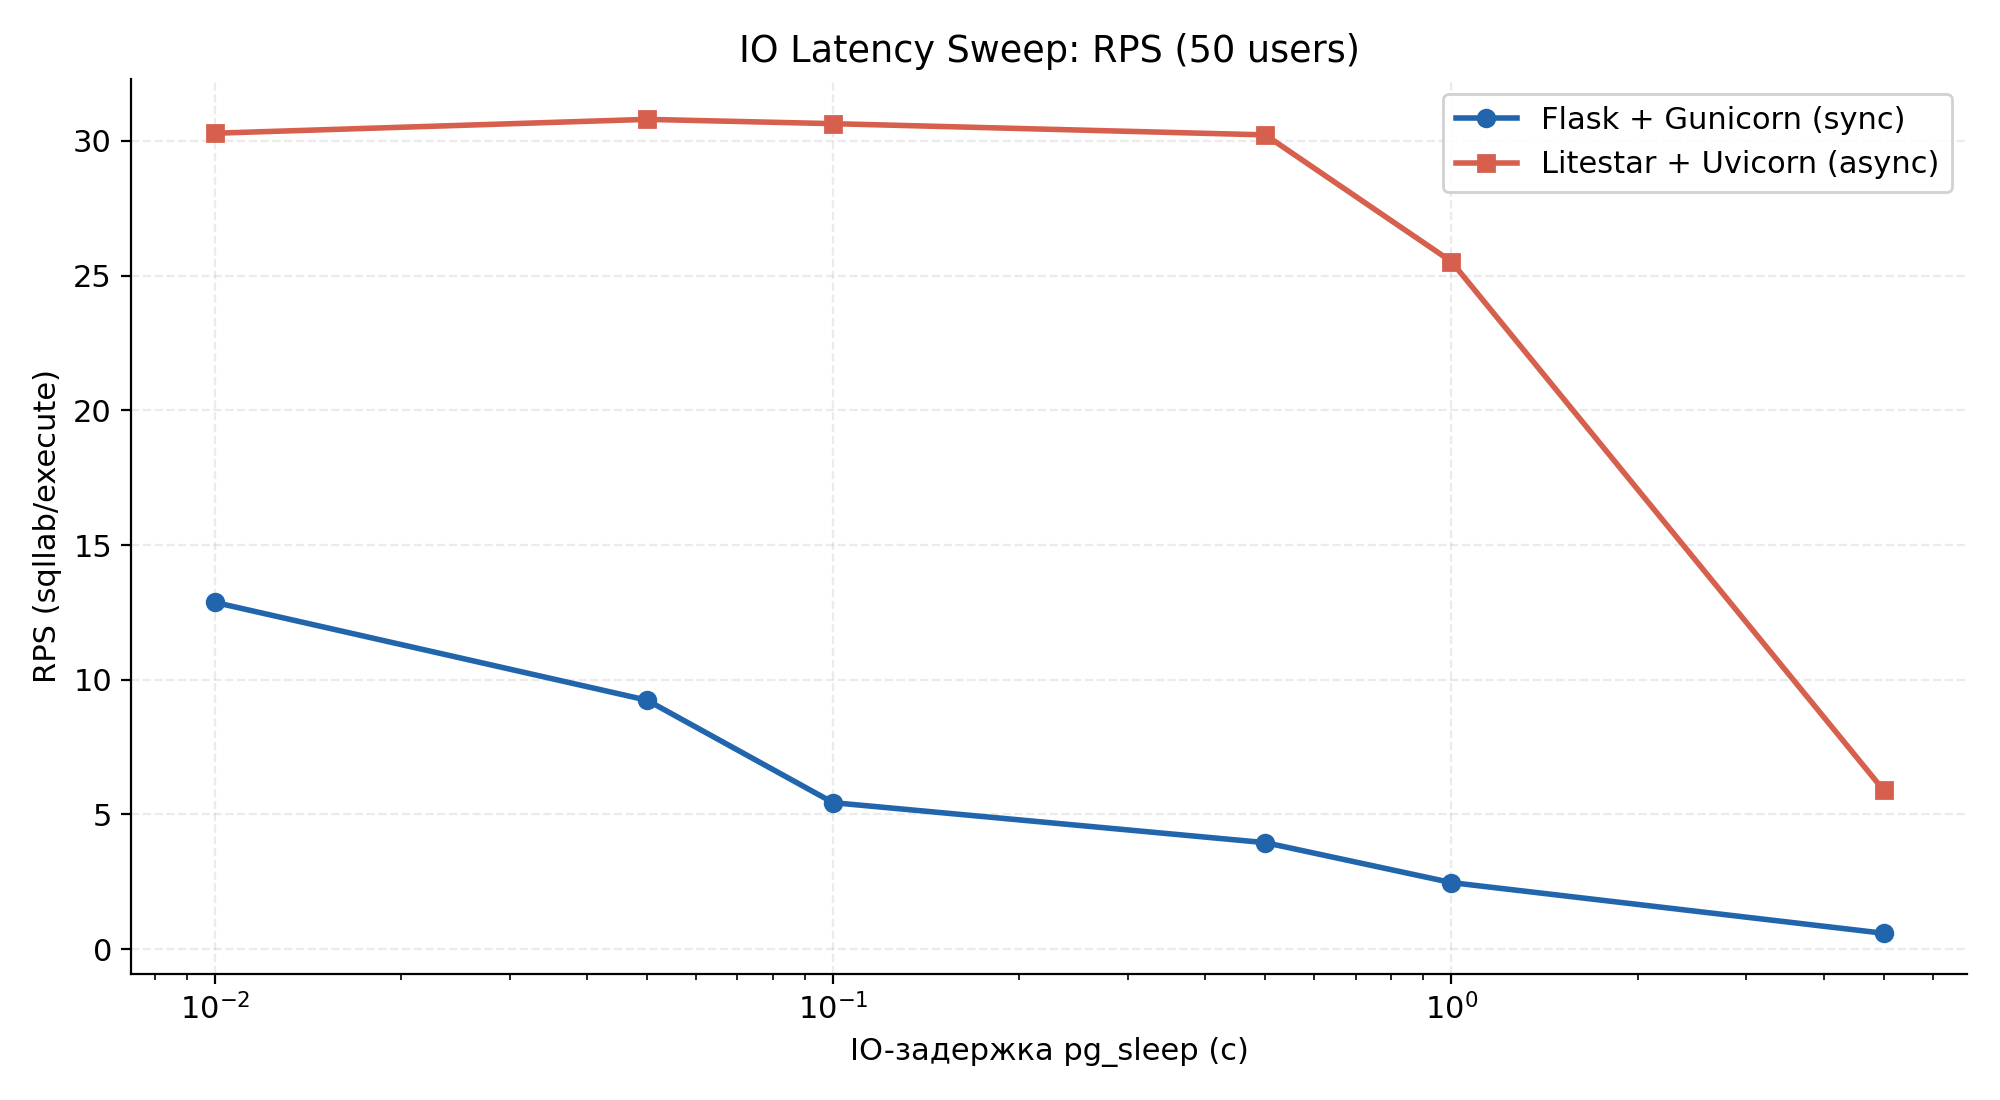
Throughput (RPS) against controlled pg_sleep IO delay (log-scale x-axis).
RPS at each IO delay (50 users):
| IO delay | Apache Superset RPS | Liteset RPS | Ratio |
|---|---|---|---|
| 10 ms | 12.87 | 30.29 | 2.4× |
| 50 ms | 9.24 | 30.80 | 3.3× |
| 100 ms | 5.44 | 30.64 | 5.6× |
| 500 ms | 3.95 | 30.23 | 7.7× |
| 1 s | 2.47 | 25.52 | 10.3× |
| 5 s | 0.59 | 5.90 | 10.0× |
Async throughput stays roughly constant (~30 RPS) from 10 ms to 500 ms — the event loop simply switches between coroutines at each await. Sync throughput falls in proportion to the delay, tracking the theoretical 4 workers / delay ceiling (e.g. ~4 RPS at 1 s). The advantage grows with IO latency, reaching 10× at 1–5 s — exactly the regime BI platforms operate in. The drop to 25.52 RPS at 1 s and 5.90 RPS at 5 s on Liteset is the asyncpg connection pool saturating, not the event loop.
Memory
The testing report records resident memory under Dashboard Fan-Out at 900 MB for Liteset against 856 MB for Apache Superset (+5 %), which it attributes to holding coroutine state and the asyncpg connection pool. Measured against readiness criterion НФТ-2 (RSS ≤ baseline × 1.15), this is reported as met.
Caveats
- These are macro benchmarks of end-to-end backend behaviour, not the speed of any individual SQLAlchemy query or chart-rendering routine.
- The PostgreSQL instance is deliberately under-provisioned (4 vCPU against ~60 M rows) so that analytical queries take 5–50 s. This makes the workload IO-bound, which is where the async model helps most and where real BI deployments live.
- Both stacks run 4 workers to isolate the concurrency model as the single variable between runs.
- Frontend behaviour is identical by construction; nothing here measures rendering time.
Reproducing
Hardware, PostgreSQL tuning, the SSB SF=10 fixture and the Locust scripts are described on the methodology page. Full Locust CSV exports (stats, stats_history, failures) and docker stats captures for every run are archived in the diploma testing report; each scenario was repeated 3 times for statistical stability.